There is much speculation on how autonomous vehicles could impact urban land use. I began to explore this public curiosity; beginning a research project which is eternally underway.
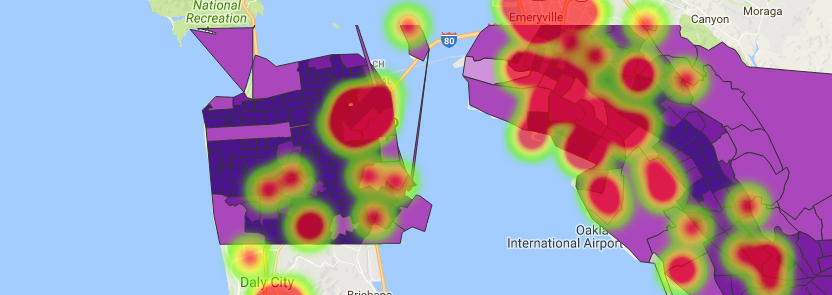
I gathered Census demographic data in addition to finding other characteristics of car dependency, such as parking lot data. I then visualized the datasets using the d3.js library in JavaScript & Open Street Maps, including range sliders and toggling features to easily segment the closely-related datapoints from outliers.
Running the tabular data through various analytical models, I am aiming to identify relationships to answer larger questions about the potential transformations:
- Can there be a large enough reduction in large parking lots to boost urban infill & affordable housing efforts?
- How would the obsolescence of existing land uses impact localized tax bases and revenue?
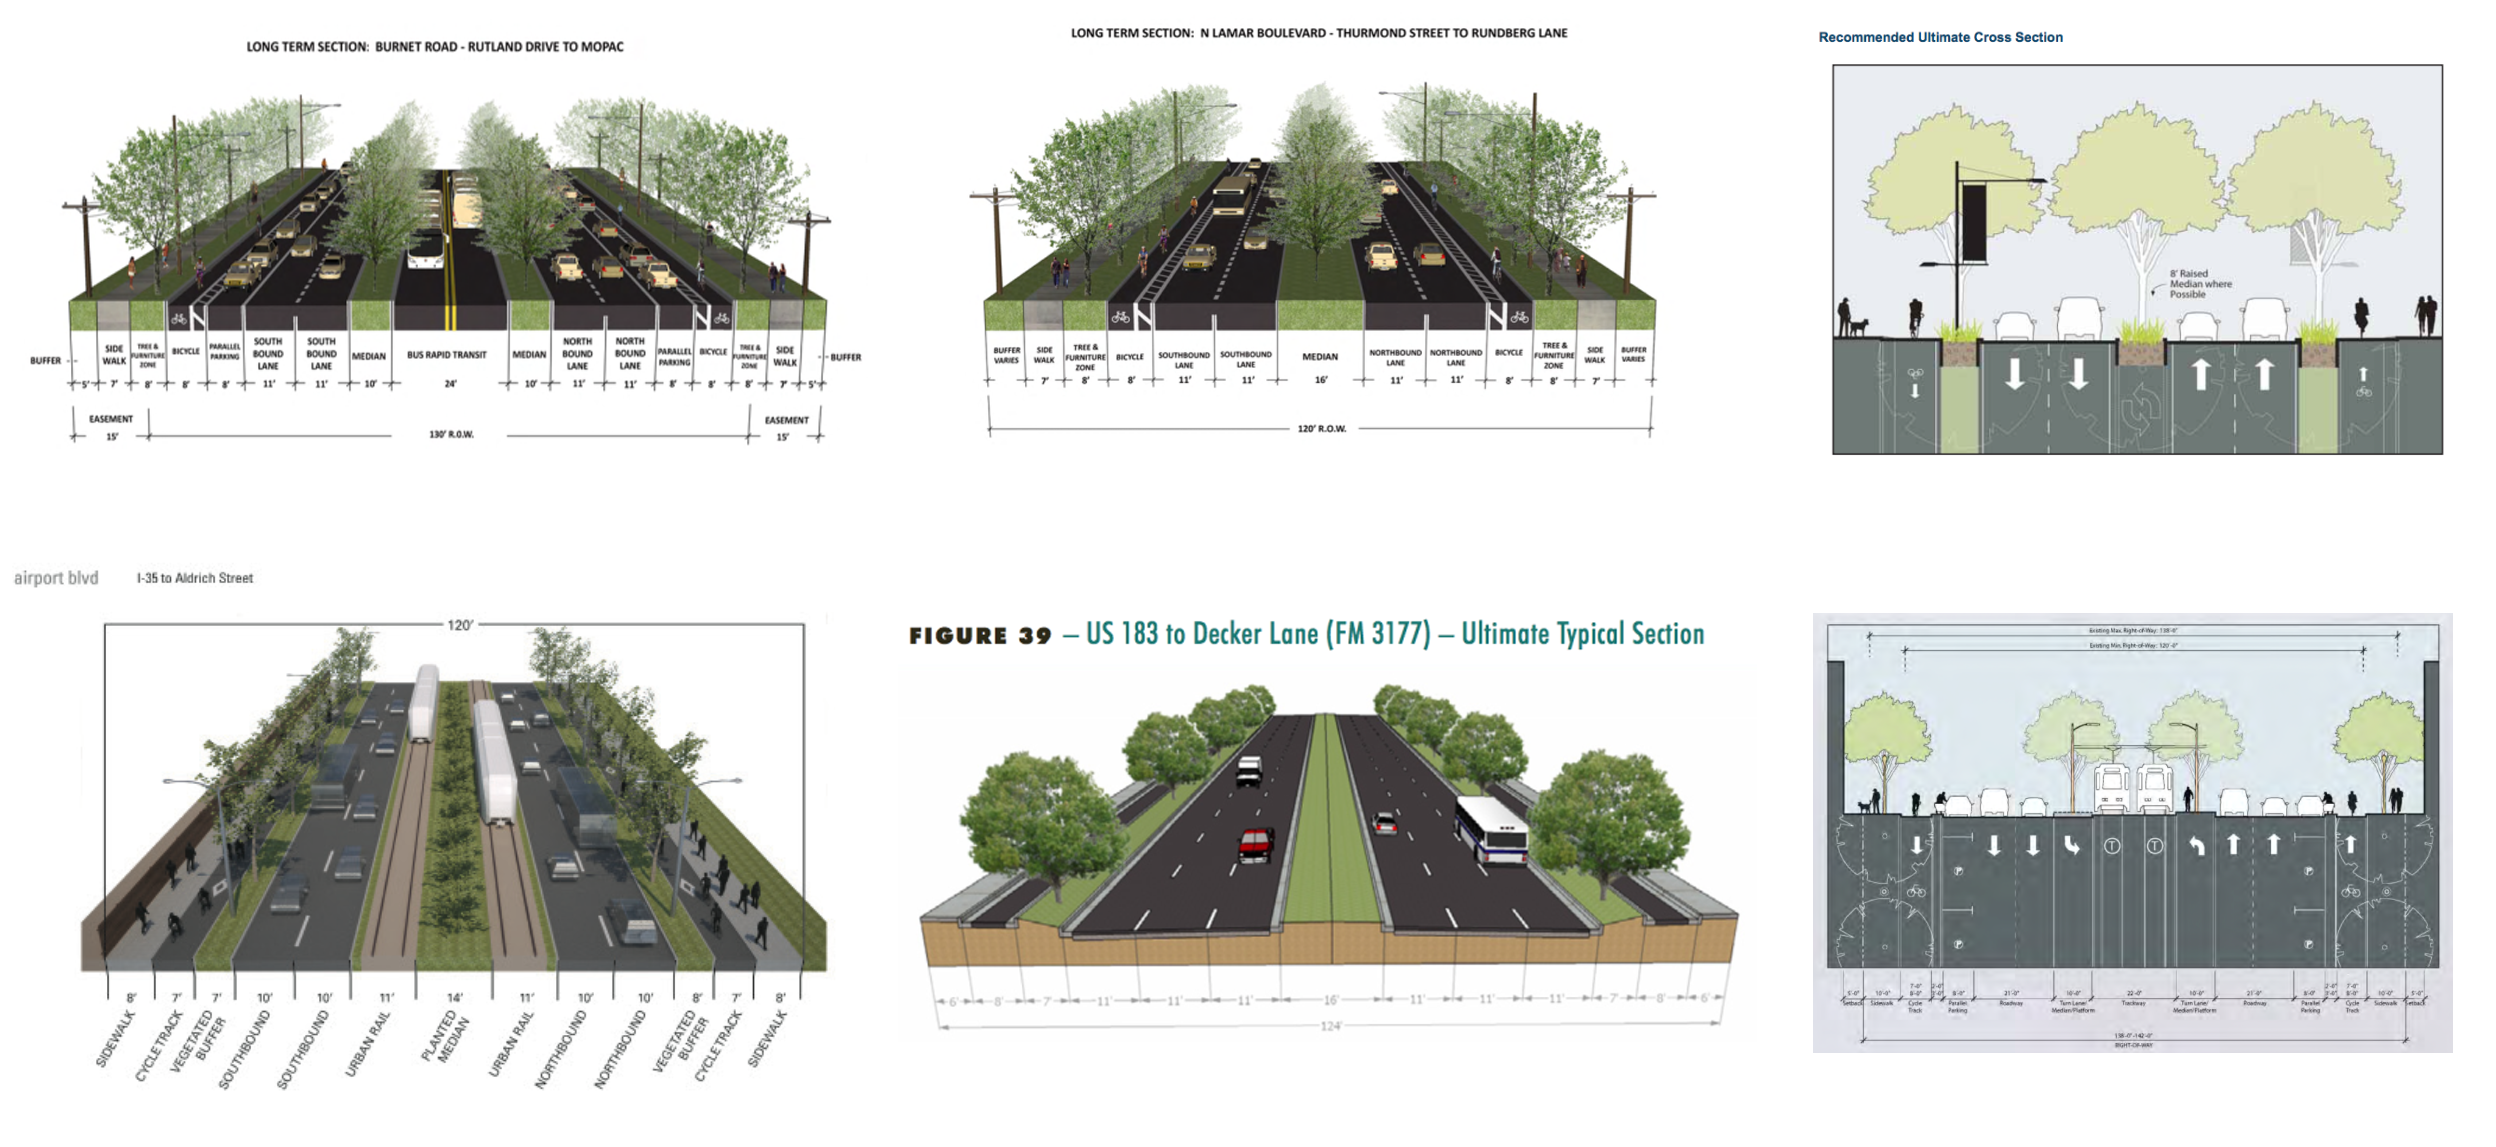
- Which major vehicular corridor ROWs could be optimized to handle the new types of traffic flows?
- Where should urban regions focus land use retrofitting?
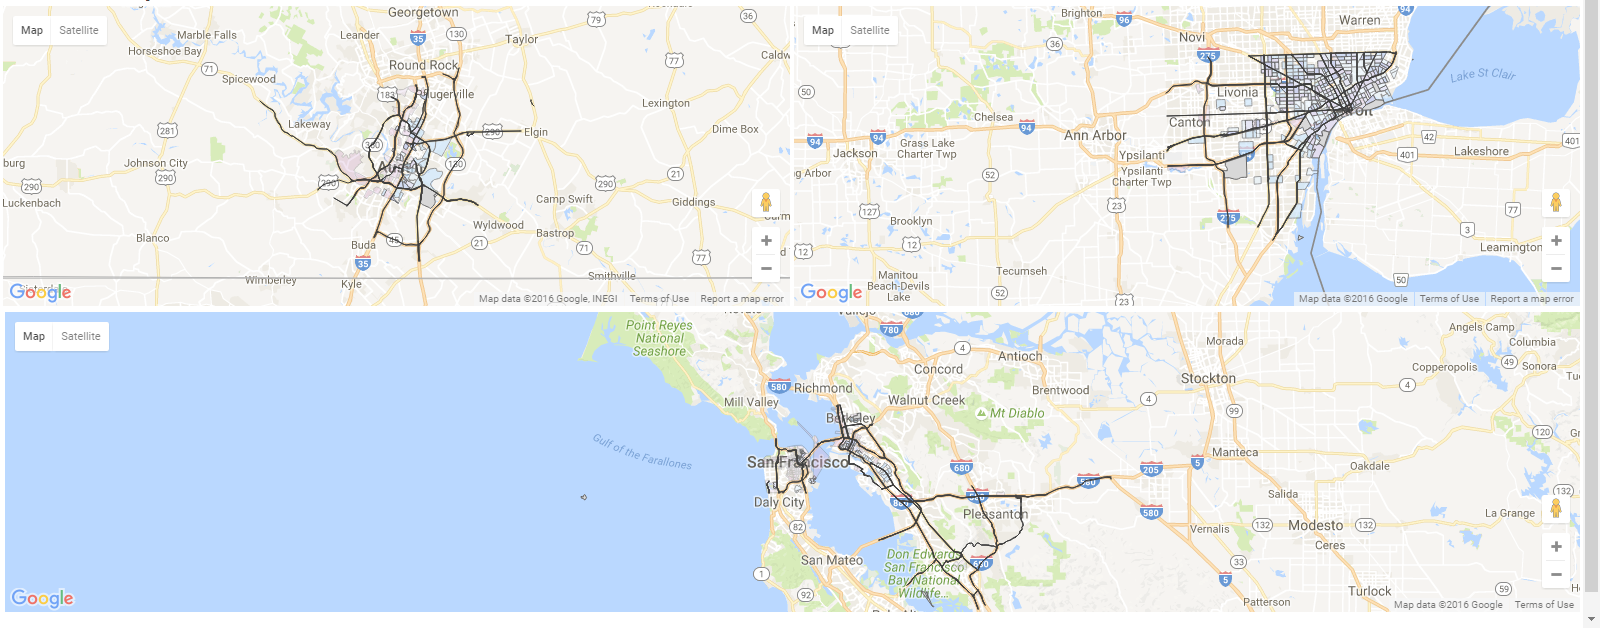
I am initially applying these questions to 3 very different American metropolises:
Austin, TX is a high-growth city with a near uniformly low population density. It is also highly car dependent.
Bay Area, CA has high population growth, very high population densities and lower car dependency in large portions of the region.
Detroit, MI has very low population growth, with moderate population densities. It also has high variation with levels of car dependency.
Reducing the dimensions of the highly-varied datasets becomes the next step. I'm running principal component analysis in addition to other analytical tools in Python to identify closely related or inversely related features. I am also normalizing the datasets to account for regional variation, splitting the data ranges into logarithmic quintiles for each region.
As the dimensions are reduced, I may introduce other traffic-related data to help explore the answers to the aforementioned questions.